ChartBrick
Create charts and dashboards from Notion, Google Sheets & more - embed anywhere


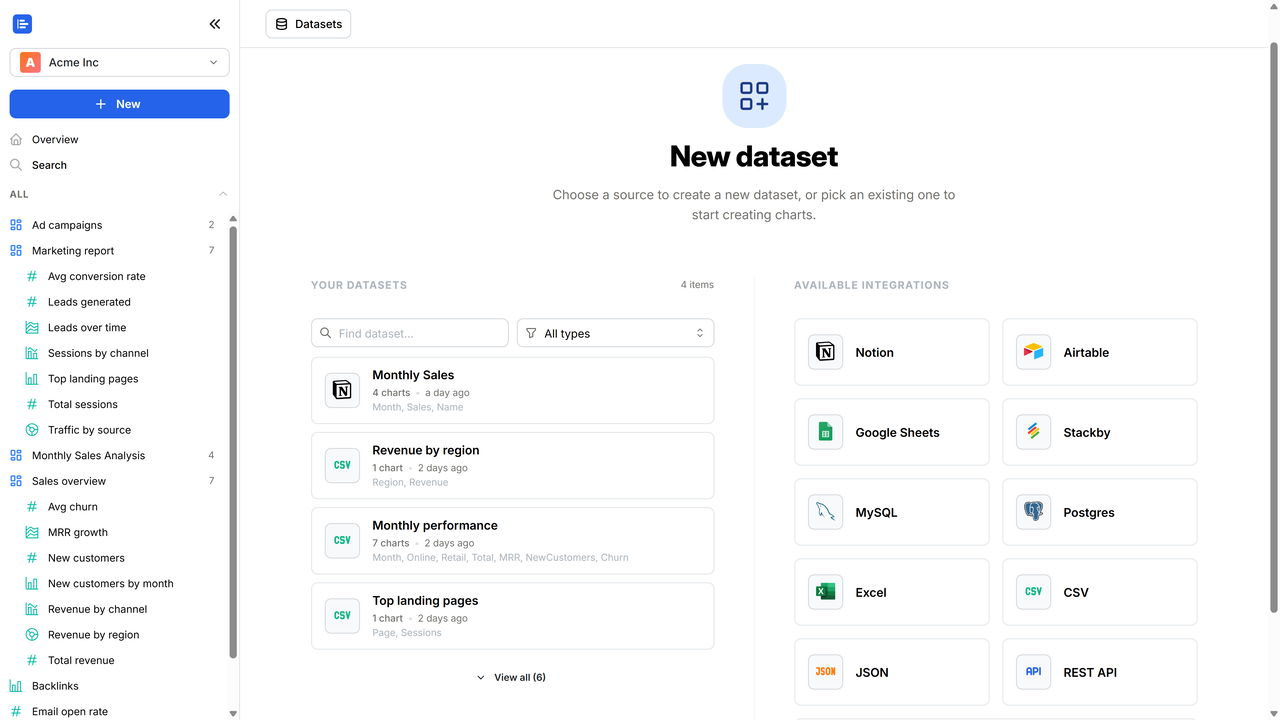
Your data already lives in Notion, Google Sheets, Airtable, databases, and more — it just isn't a chart you can share.
ChartBrick turns it into one: connect any of 10 sources, let AI build the charts and dashboards, and drop a link or live embed anywhere. Easy, no code.
See it live — no signup needed:
TL;DR
At-a-glance
Alternative to
Integrations
Overview
Let AI build your charts for you
- AI does the first pass — it reads your columns (never your row values) and builds a dashboard of up to 4 charts, each answering a different question, each in the chart type that fits.
- AI does the building — Keep it as-is, or tweak anything.
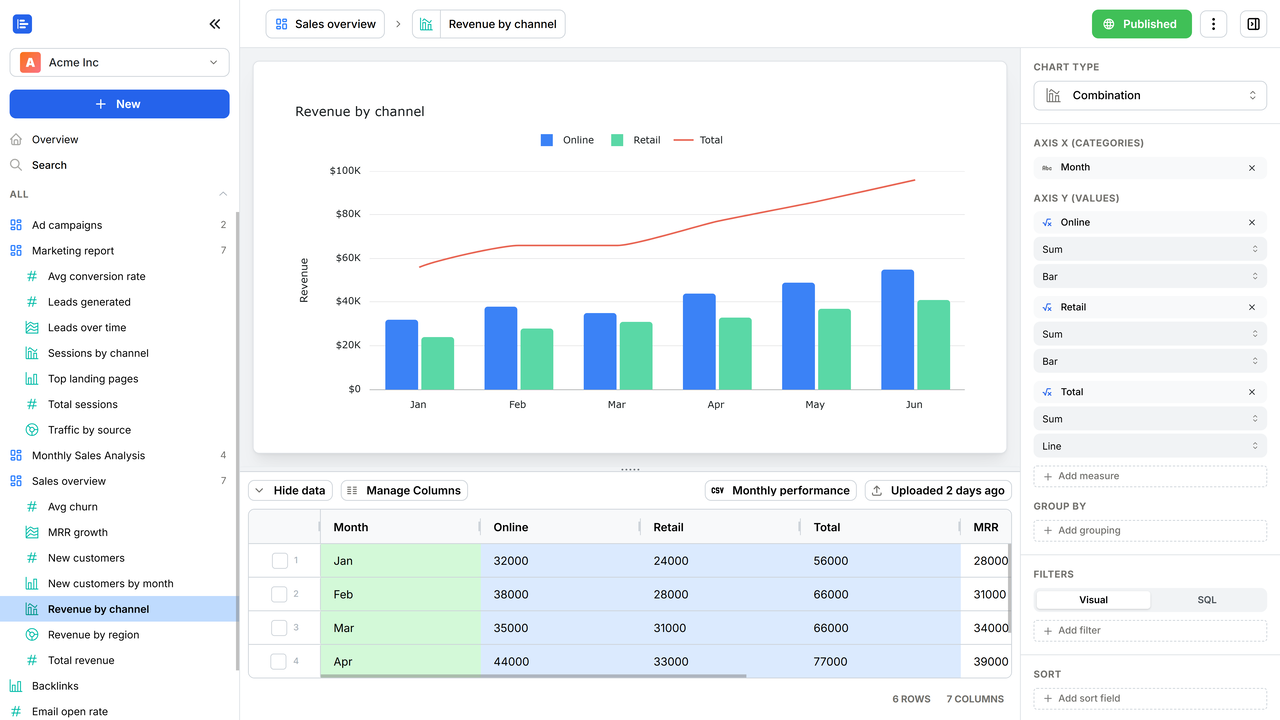
20+ chart types — pick any Bar & column · Line · Area · Combination · Scatter · Bubble · Histogram · Waterfall · Heatmap · Pie · Donut · Nightingale · Radar (area & line) · Radial bar · Radial column · Funnel · Cone funnel · Pyramid · KPI cards · Data tables
Make it look right in clicks
- Restyle by clicking, not coding — colors & palettes, legend, axis titles, data labels, number formatting (currency, %, decimals, compact), and reference lines. No design skills needed.
- Build dashboards by dragging — add or remove charts, resize and move them on the grid, and refresh them all in one click.
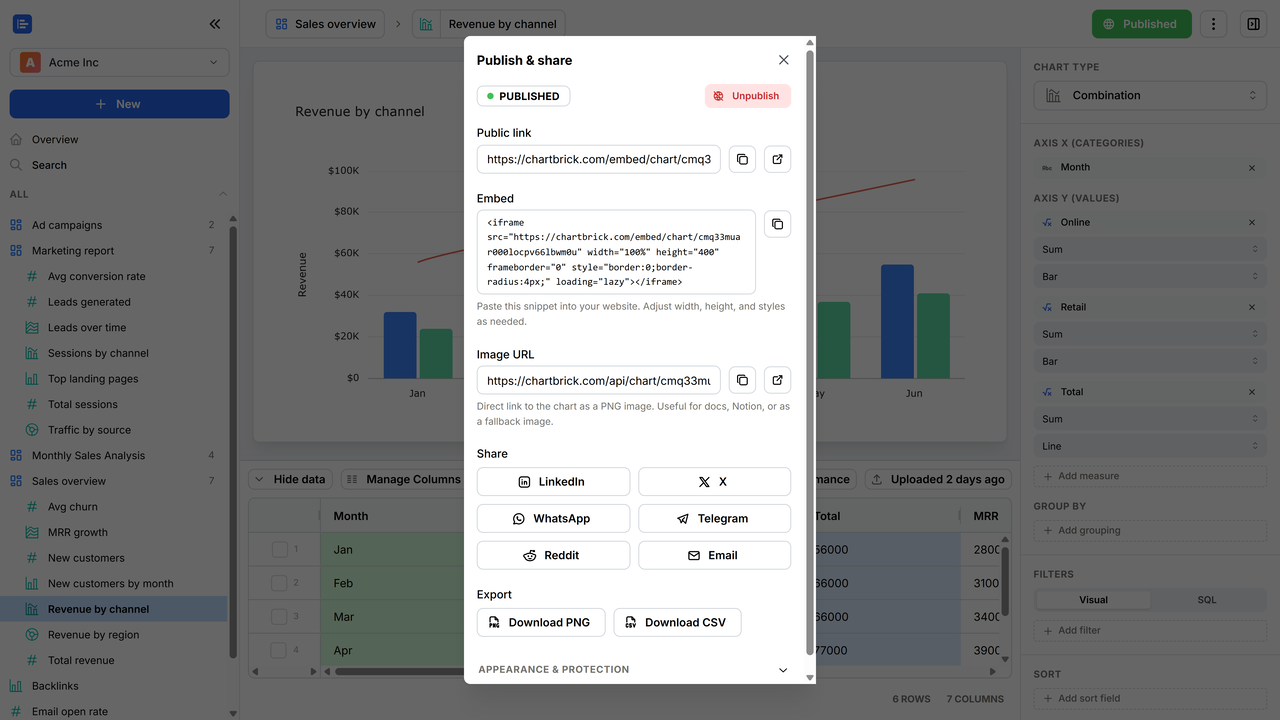
Share it, embed it, hand it off
- Share one public link — to a single chart or a whole dashboard.
- Embed a live chart or dashboard — drop it into Notion or any website. It stays interactive — readers hover for exact values and toggle series — and updates with your data, never a screenshot.
- Always up to date — set sources to refresh hourly, daily, or weekly, and your charts, dashboards, and embeds update themselves.
- Export to hand off — a chart as a PNG, a dashboard as a PDF, or the data as CSV.
Add collaborators
- Invite people to your workspace — by email, as admins, editors, or viewers.
- Give everyone the right access — editors build and edit, viewers stay read-only.
Keep your data yours
- Encrypted at rest — your datasets and connection credentials (AES-256).
- Locked down when you share — password-protect any public chart or dashboard, or restrict it to domains you choose.
- Never sold — every data processor we use is listed in our privacy policy.
Beautiful charts from your data, fast — no code.
Plans & features
Deal terms & conditions
- Lifetime access to ChartBrick
- You must redeem your code(s) within 60 days of purchase
- All future plan updates
- Please note: This deal is not stackable
60 day money-back guarantee. Try it out for 2 months to make sure it's right for you!