Klipfolio
Visualize and track KPIs with dashboards
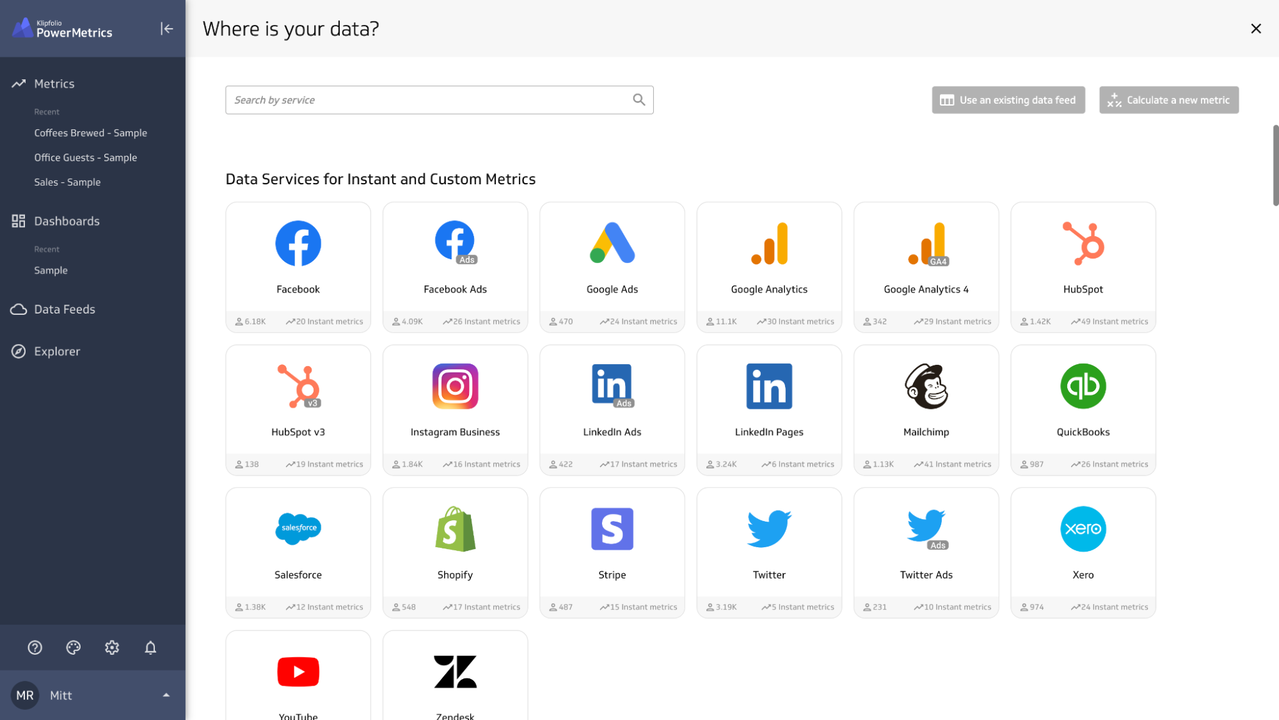
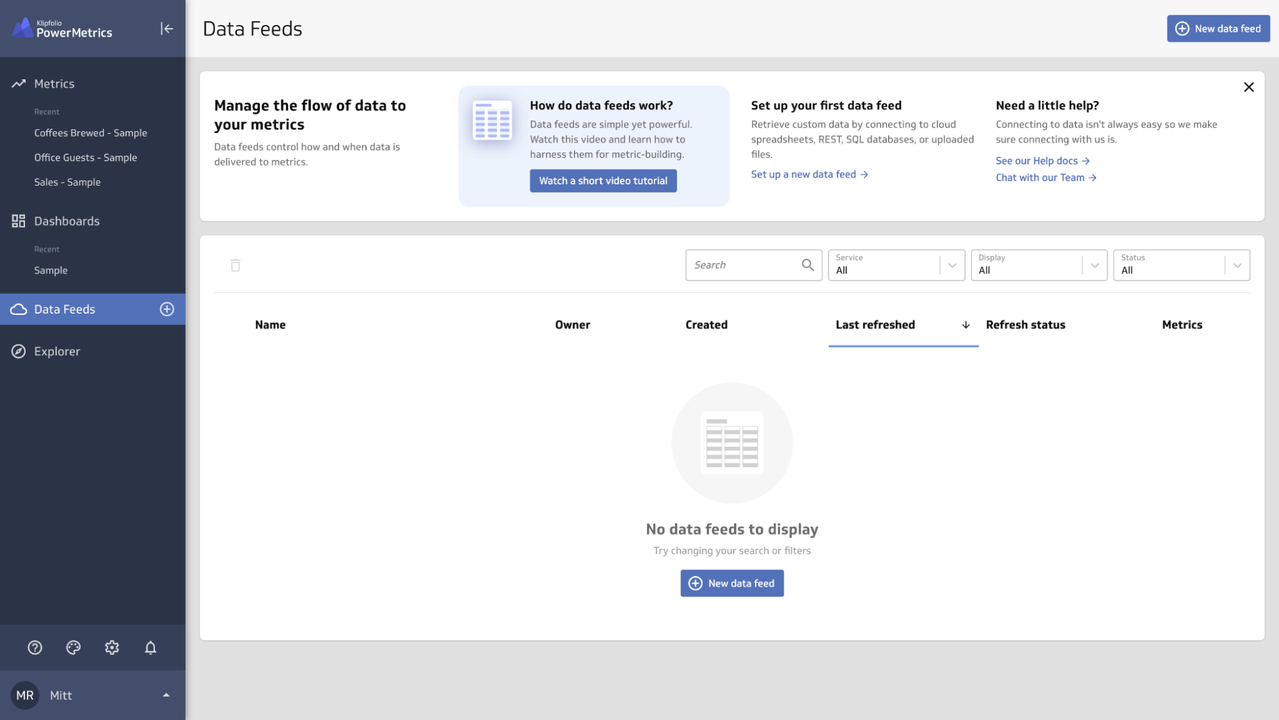
Klipfolio is an analytics software that connects to hundreds of apps directly and via the REST API and lets you import data and create dashboards and reports.
You can connect to advertising, marketing, support, and web analytics apps and software such as ActiveCampaign, Adobe Analytics, Basecamp, Google Analytics, Intercom, and Marketo. After you connect them, you can import data and make data visualizations.
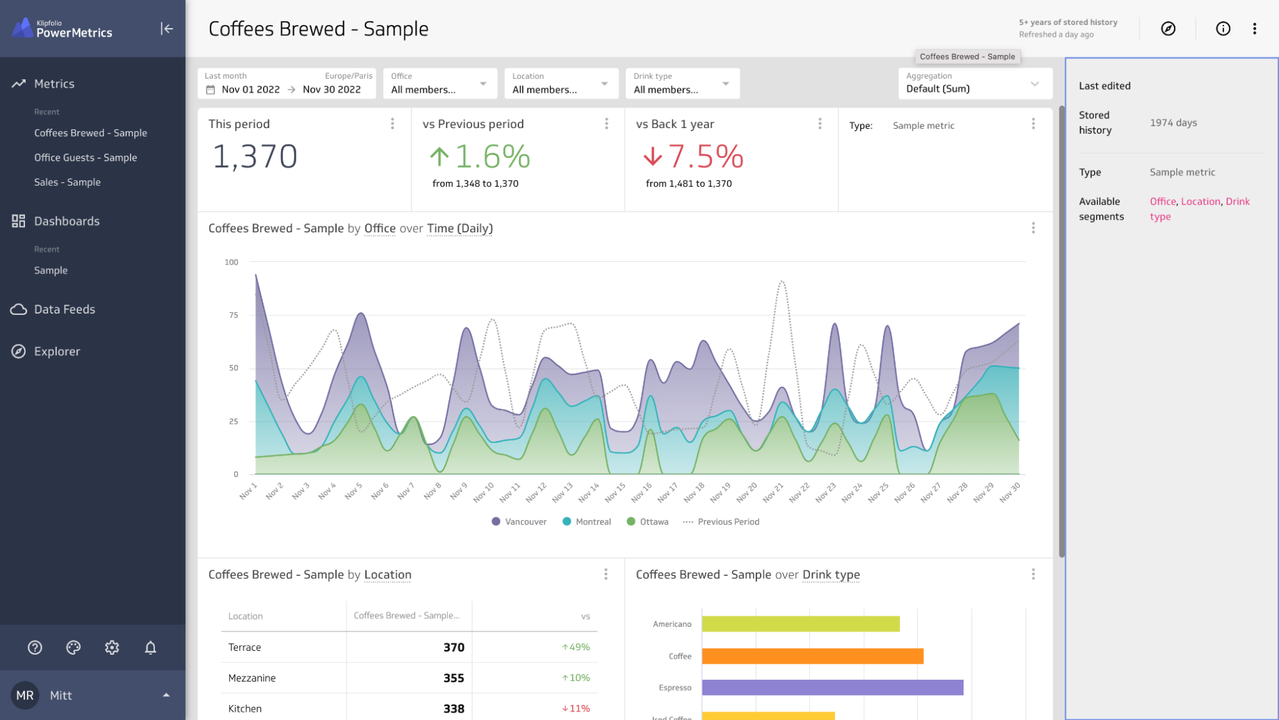
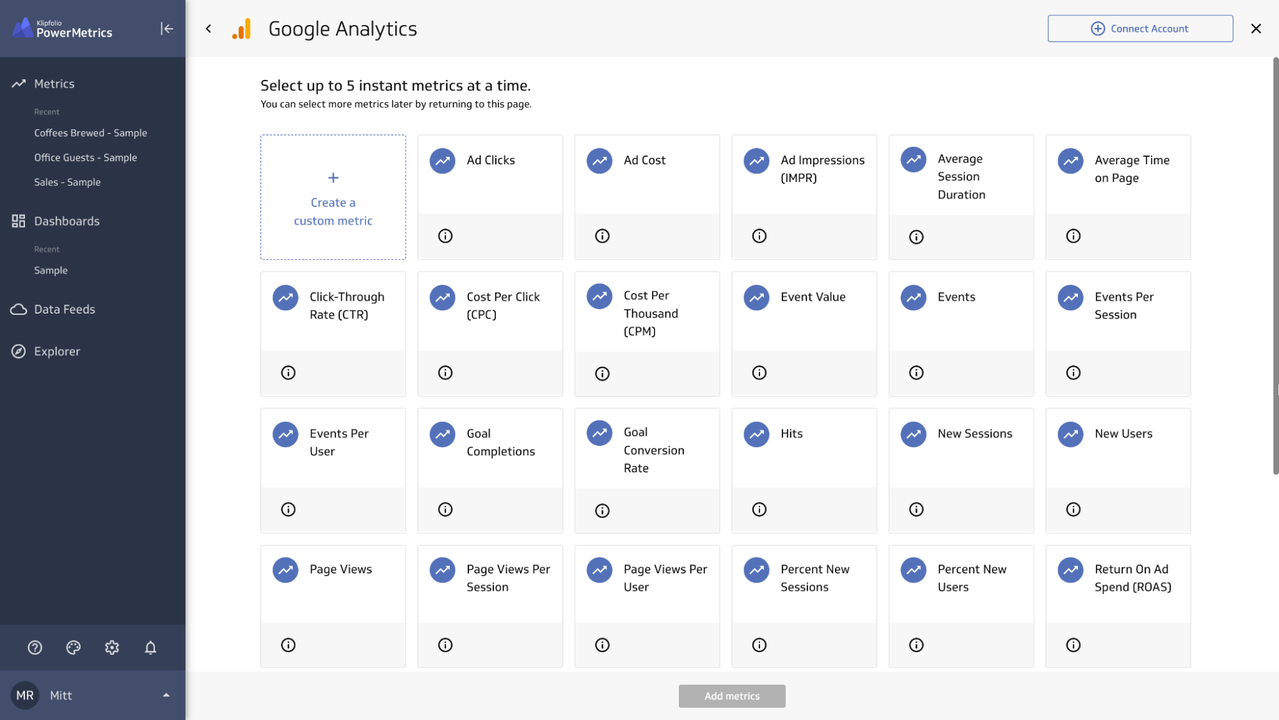
Apply filters, segment the data, choose visualization types and create analytics dashboards. Klipfolio also has a feature called PowerMetrics that automatically creates a homepage for each metric. Here you can view the metric in seven visualizations, and you can also customize the metric visualizations.
Klipfolio’s Explorer tool can help you unearth even more data by combining data from multiple sources and matching the data from up to five sources. With Explorer, you can use flexible date ranges, filters, and visualizations to interpret the data better. There are also Klip Galleries which are templates that help you quickly create visualizations for vital KPIs.
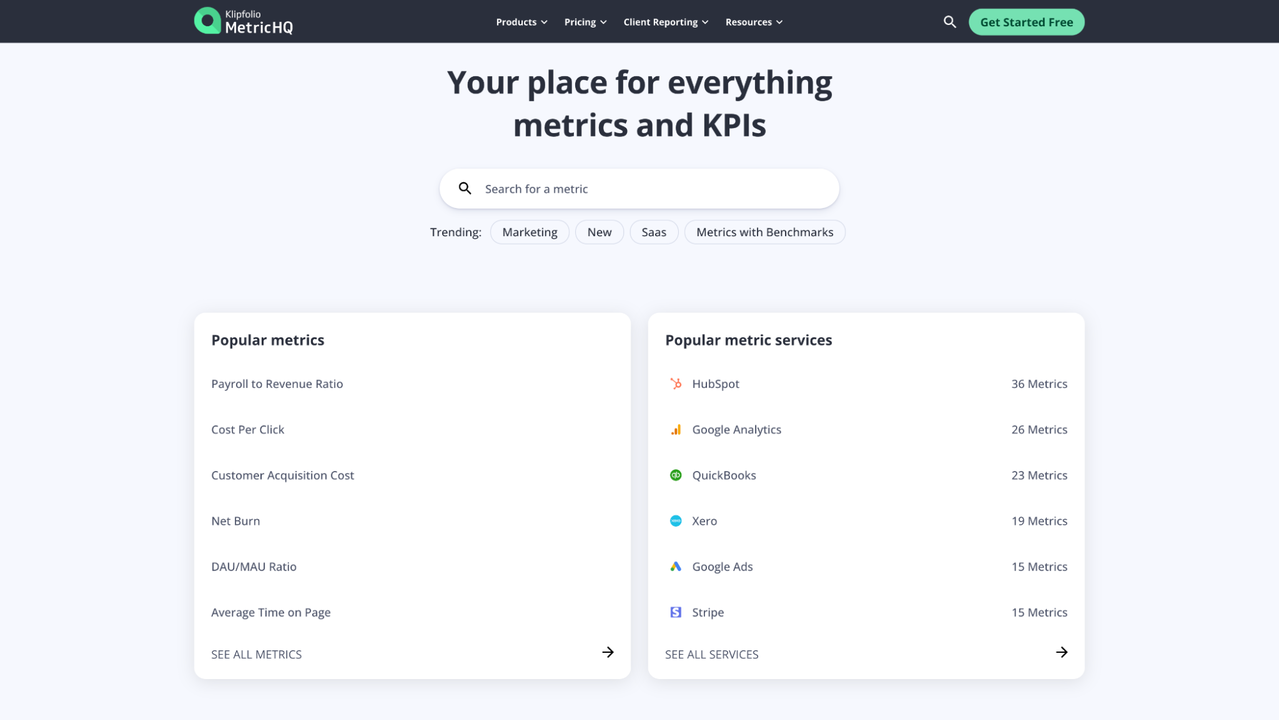
Klipfolio also offers tons of data via MmetricsHQ. Here you can find data from reports made by authoritative figures in your industry. You can use them to set realistic goals and benchmarks. Kilpfolio offers two types of goals—threshold and recurring.
Set your goals within Klipfolio, which makes it easy to track your progress. If you turn on goal notifications in Klipfolio, it will either email you or notify you directly via the app when you reach those goals. You can also choose to get notifications when you aren’t likely to reach the goals, so you can make modifications.
You can invite team members to your dashboards so they can view the metrics in real time. You can assign roles and create groups to protect your data. It also lets you generate PDF reports that you can send via chat or email.
Key features
- Connect hundreds of apps and import data
- Segment data and apply filters
- Create visualizations for the metrics
- Create homepages for each metric
- Use Klip Gallery templates to create visualizations for vital metrics quickly
- Receive notifications when you reach or miss goals
- Share dashboards and reports with team members, colleagues, and clients
TL;DR
At-a-glance
Best for
Features
Overview
Plans & features
Deal terms & conditions
- Digital download of Klipfolio
- Yours forever if you download and save within 60 days of purchase
- This deal is non-refundable