Metabase
Access, visualize & analyze data easily
Metabase is an open-source business intelligence and data visualization tool that allows companies to transform their data into easy-to-understand visual elements such as graphs, charts, tables, and more.
Traditional data visualization methods and languages make it difficult for employees and team members who are unfamiliar with structured query language (SQL) and graphical user interface (GUI) to access and analyze the data stored in databases.
Metabase's primary focus is to make it easy for companies and their teams to make sense of data, whether or not they are familiar with SQL or GUI.
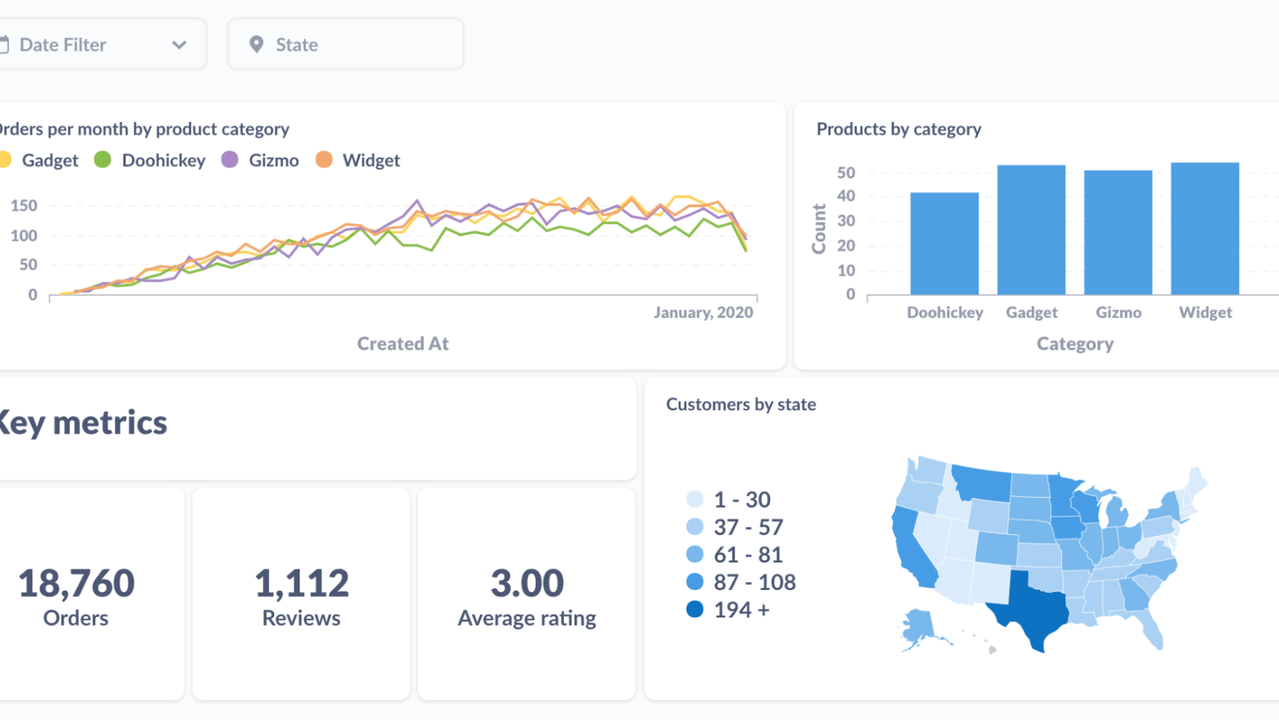
The tool allows you to ask questions about your data and displays the answers in formats that make sense to you. It mainly shows data in detailed bar charts, diagrams, graphs, or tables. With those, everyone from analysts and frontline staff to CEOs can access and explore the data for insights.
Metabase connects to your database and presents live data in a user-friendly way. Its intuitive interface guides you to organically filter, aggregate, and bring your data to life in beautiful visualizations.
The easy-to-use visual query builder leverages the power of SQL allowing anyone to join and drill down into their data to make better decisions.
Similarly, the Notebook editor allows you to ask more sophisticated questions and visualize results in meaningful ways. This will enable users to filter and summarize data in the way that makes the most sense to them.
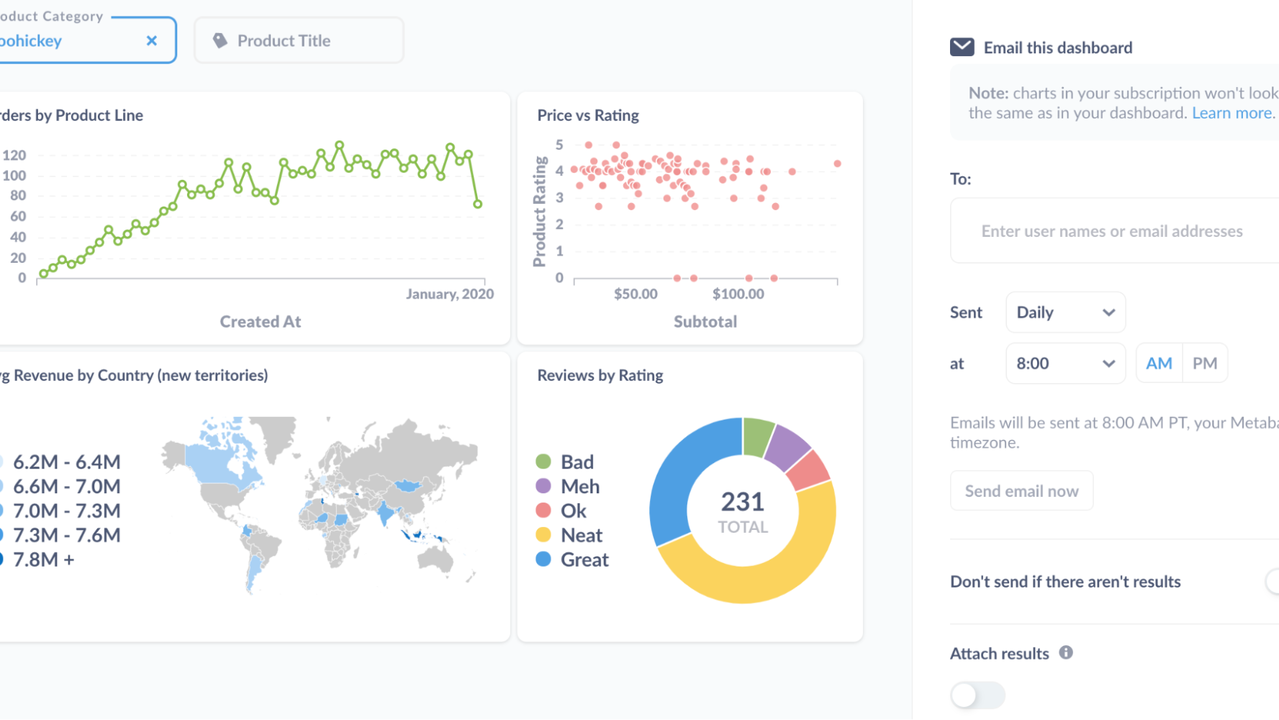
Metabase provides live dashboards and automated reports that make collecting and sharing data easy. Markdown text cards allow you to organize questions and patterns in a dashboard and contextualize them.
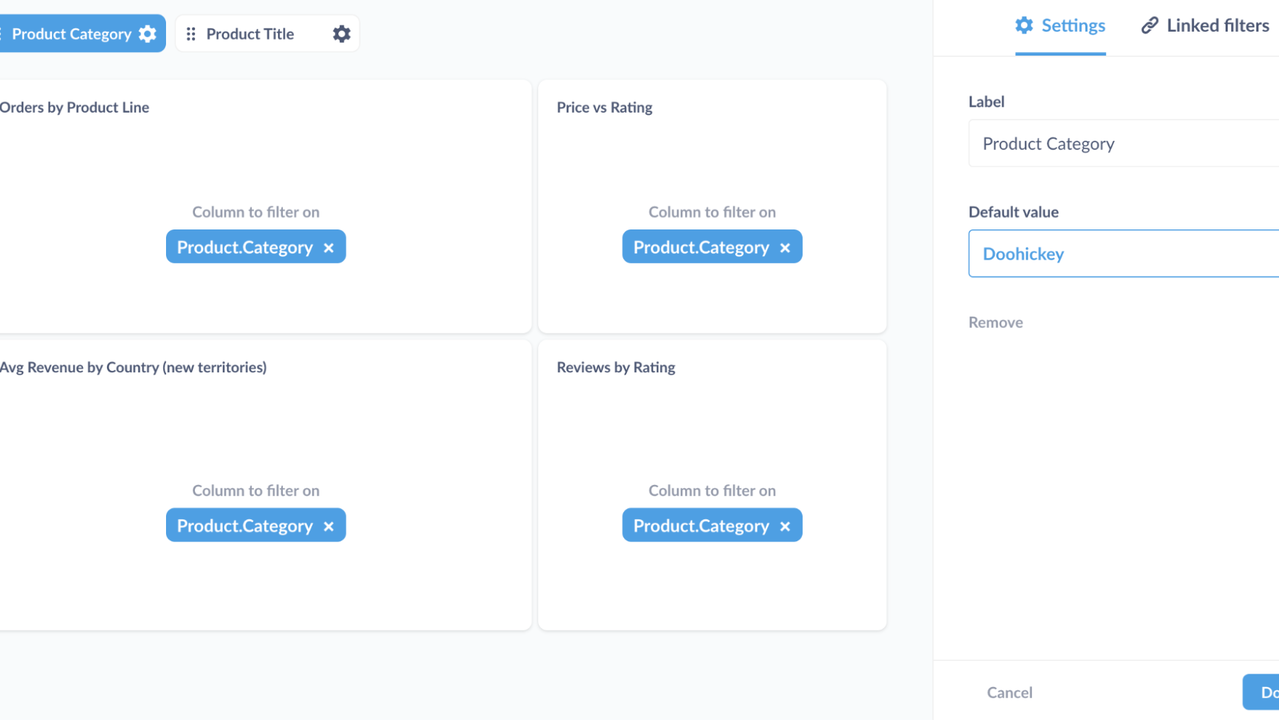
You can also add filters to dashboards and connect them to question fields to refine results. The Data Browser lists all your databases and gives you a place to add context. You can browse tables and their fields, see sample data, and a list of questions that query that data.
Manually locating data in a large database can be overwhelming. The search bar allows you to find any data while staying organized. You can use it to find anything in your Metabase, including data, indicators, segments, dashboards, templates, and questions.
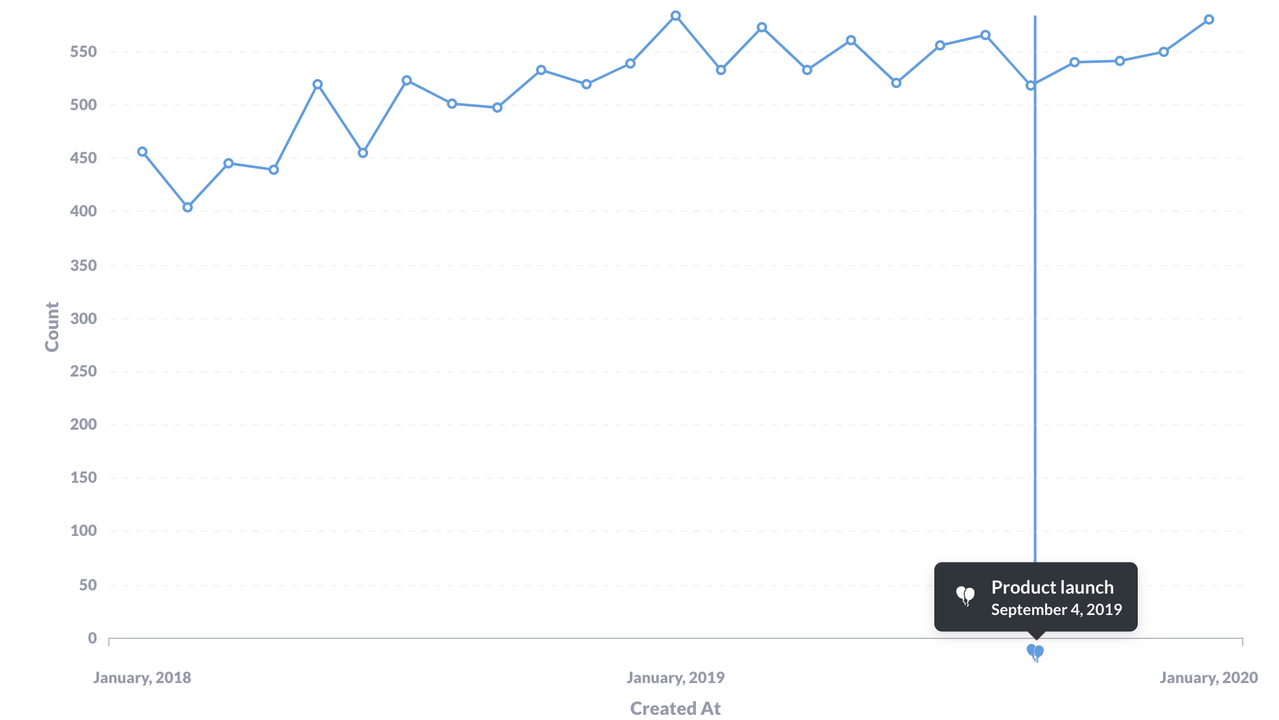
The Events and Timeline features allow you to capture important dates and make data and insights available when needed.
Key features
- Quickly browse and search data in the database
- Use queries to find and aggregate data
- Embed your product
- Automatically record and share your work with others
- Create a beautiful and meaningful dashboard for data visualization
- Let your team make sense of data whether or not they are familiar with SQL and GUI
- Add filters and consistently access refined data
TL;DR
At-a-glance
Best for
Alternative to
Integrations
Features
Overview

Plans & features
Deal terms & conditions
- Digital download of Metabase
- Yours forever if you download and save within 60 days of purchase
- This deal is non-refundable