Chartmat
Build apps and browser dashboards with way less effort using Google Sheets
Trying to create your own dashboard to visualize data can feel like a DIY project gone wrong. (“I don’t think duct tape is going to get our security deposit back.”)
But without a fast and accessible way to see your metrics and build reports, it’s impossible to make data-driven decisions in your business.
If only you could turn your trusty Google Sheets into an embeddable site dashboard that can be updated in real time—without learning how to code.
Make way for Chartmat.
TL;DR
Overview
Chartmat lets you build dashboards, apps, and forms using real-time data from Google Sheets.
Chartmat provides a powerful, mobile-friendly, and responsive frontend to Google Sheets that lets you build boards using different block types, including charts, tables, forms and grids.
The blocks always synchronize in real-time with Google Sheets, making them the perfect replacement for management reports.
You can also use boards as internal apps to display information, collect data, or monitor activities.
Create boards without any coding knowledge and organize them in workspaces, so you can safely share them with clients and teammates.

Fully customize your charts and keep them updated in real-time by synchronizing them with Google Sheets.
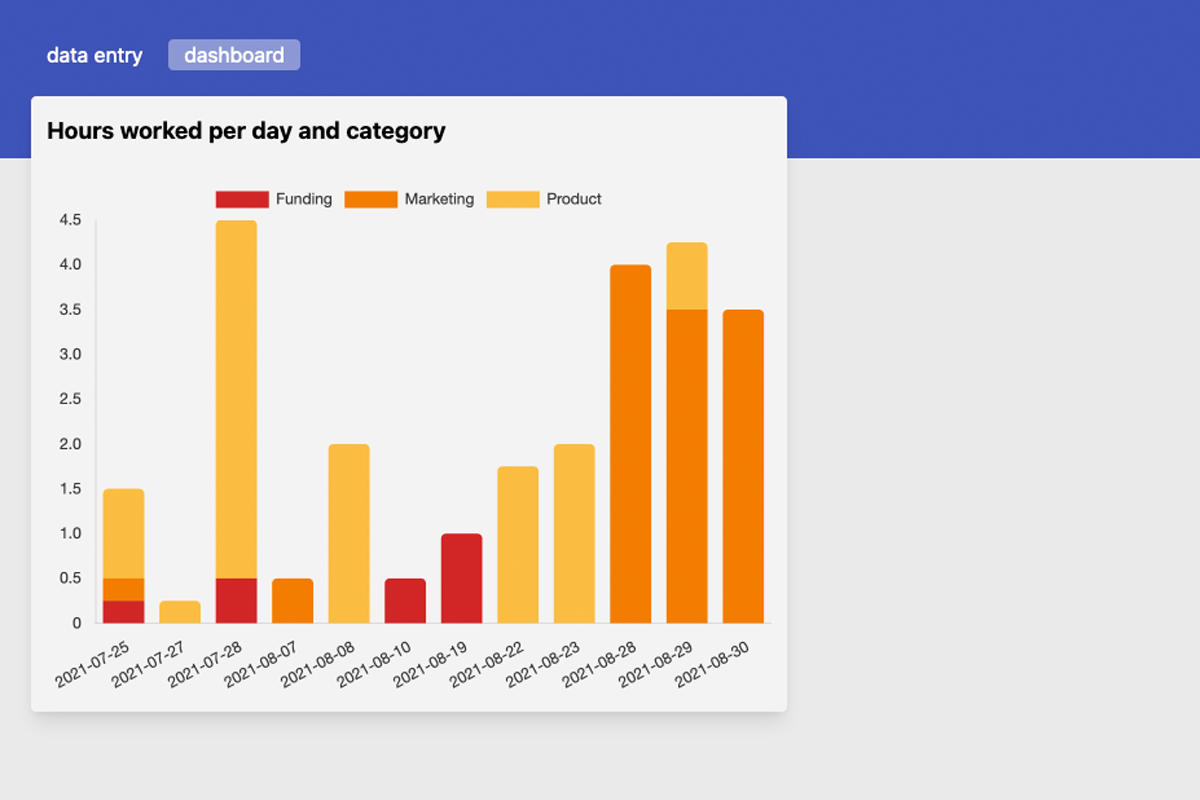
Charts allow users to aggregate and display data in a chart with fully customizable axes, colors, and scales.
You can query table data directly from the Chartmat board with clickable rows that even let you observe details that aren’t included in the table.
With grids, you can highlight data representations, especially images, in a way that your end users are sure to love. And you can even build small stores on top of Chartmat!

Build a small online store on top of Chartmat by using grids to visualize the information.
Write data from browser forms into your Google Sheet and customize the input format of your Chartmat forms based on your individual needs.
You can display forms and dashboards in the very same Chartmat board to avoid flipping through tabs to find what you need.
With these forms, you'll even be able to upload images, such as receipts, directly into Google Sheets.

Record data with different field types using forms that even let you upload images.
Chartmat makes it possible to tailor your boards using sections to structure all your content.
Customize your board header through HTML and CSS and display your company logo for a sweet branding moment.
And to really level up your board, you can also change the background color of your boards and the display color of any internal element.

Customize many different elements of your board using Chartmat’s intuitive interface.
Right now, your data looks about as straightforward as someone miming the plot of Inception in a game of charades. (“How would I get Leonardo DiCaprio from you dabbing?”)
Chartmat lets you visualize your data using Google Sheets, so you can make all your business decisions based on the most up-to-date information.
Build powerful dashboards from the comfort of your web browser.
Get lifetime access to Chartmat today!
Plans & features
Deal terms & conditions
- Lifetime access to Chartmat
- All future Pro Plan updates
- No codes, no stacking—just choose the plan that's right for you
- You must activate your license within 60 days of purchase
- Ability to upgrade or downgrade between 5 license tiers
- GDPR compliant
60 day money-back guarantee. Try it out for 2 months to make sure it's right for you!
Features included in all plans
- Embed boards and blocks (via iframe)
- Mobile-first platform that can be installed on your phone
- Synced with private sheets
- Separate user permissions for each workspace (shareable with clients and teammates)
- Full customization (add your brand colors and board name)
- No Chartmat branding
- Access to all templates
- Integrations: Zapier, KonnectzIT, Pabbly Connect, and any other tool that integrates with Google Sheets