Build no-code dashboards in real time

Dashtera

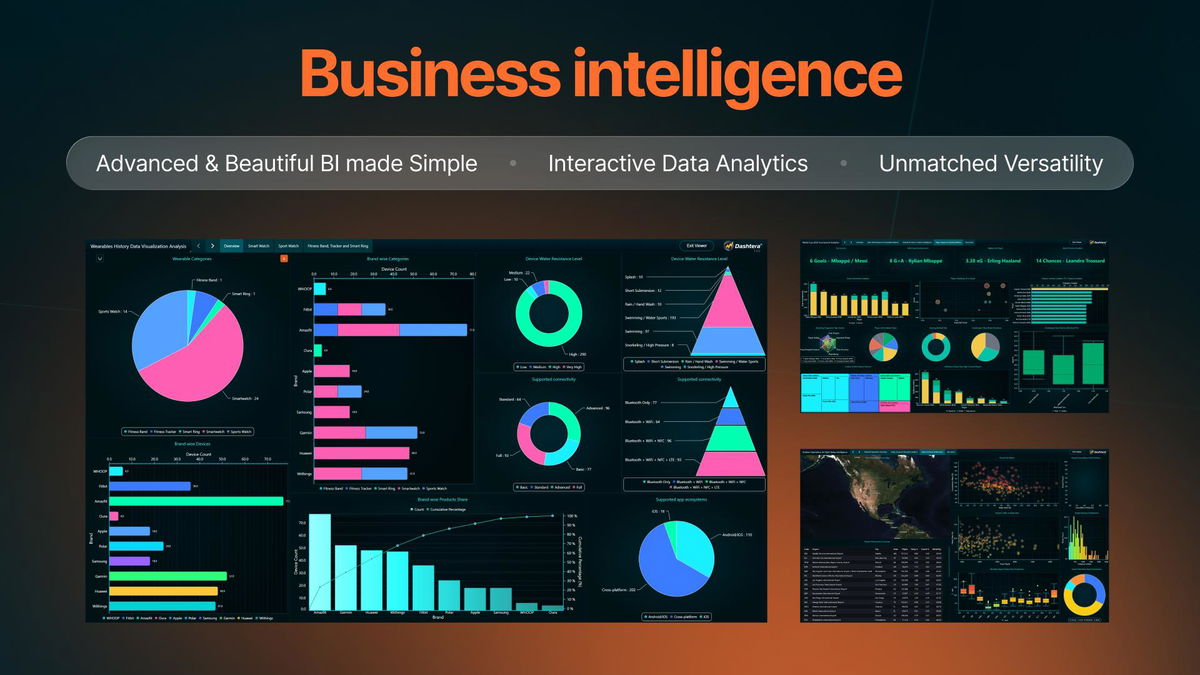
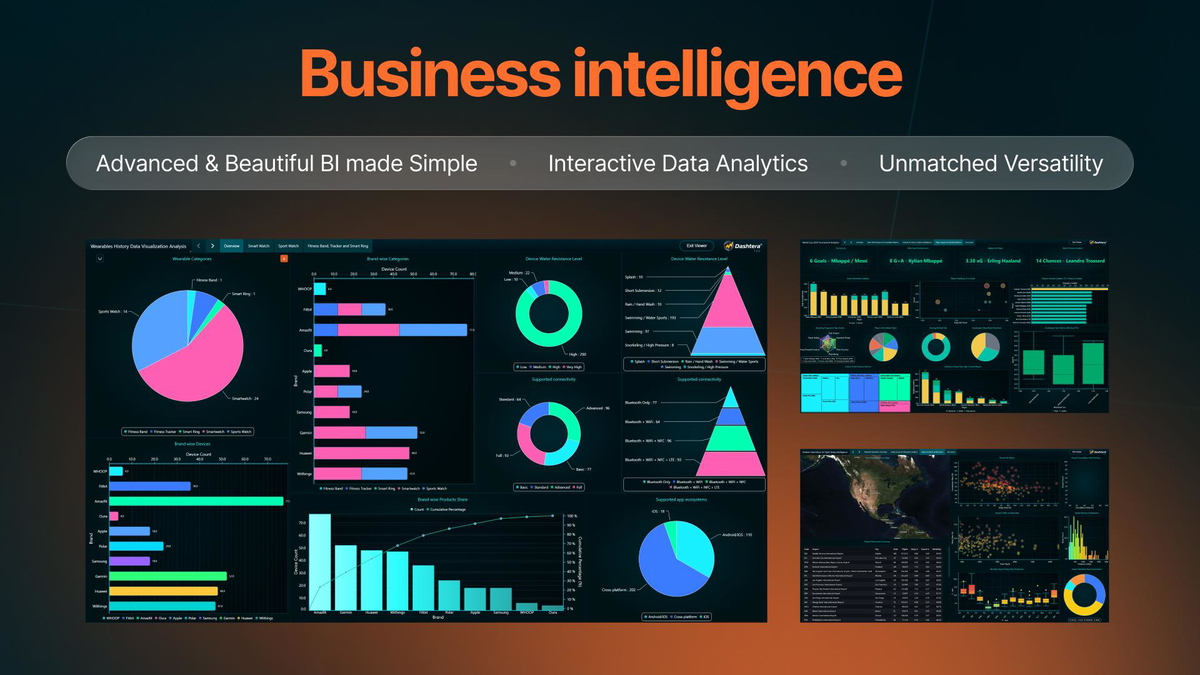
Business intelligence
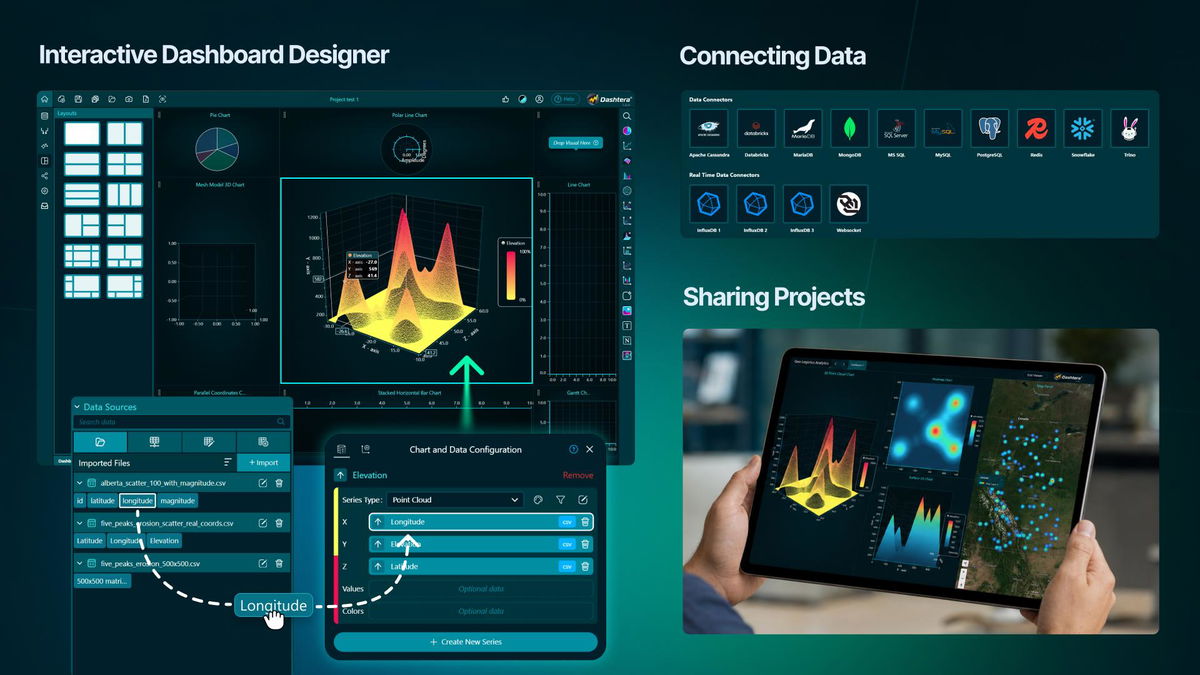
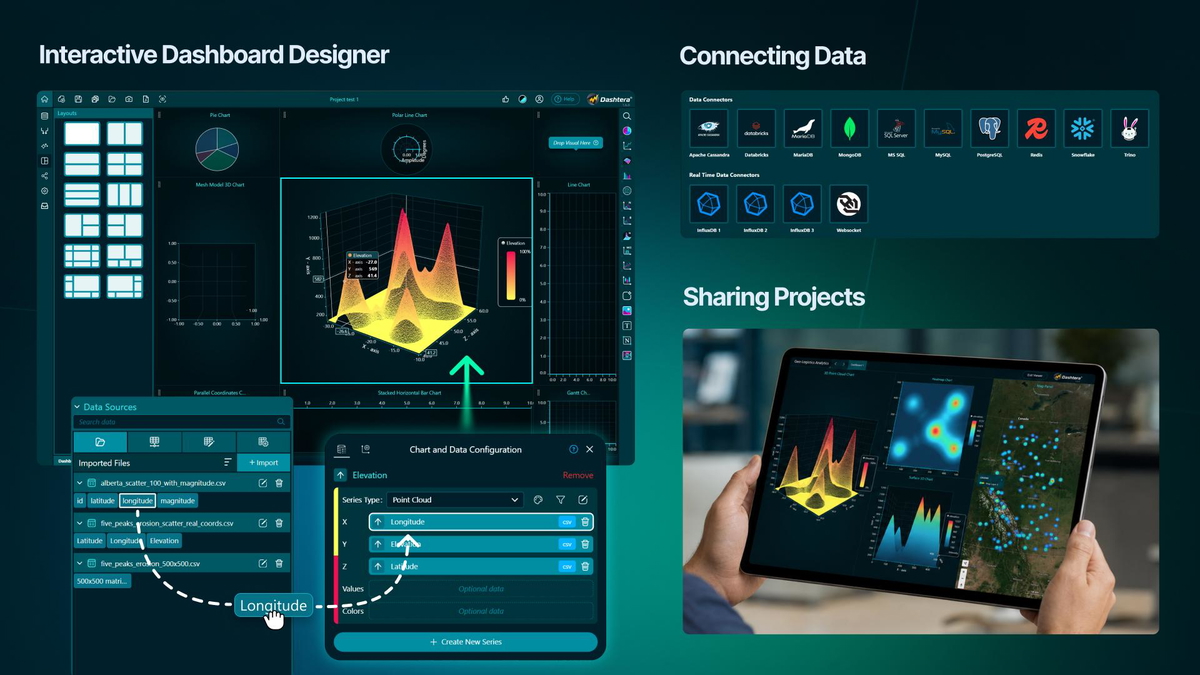
Dashboard designer and connectors
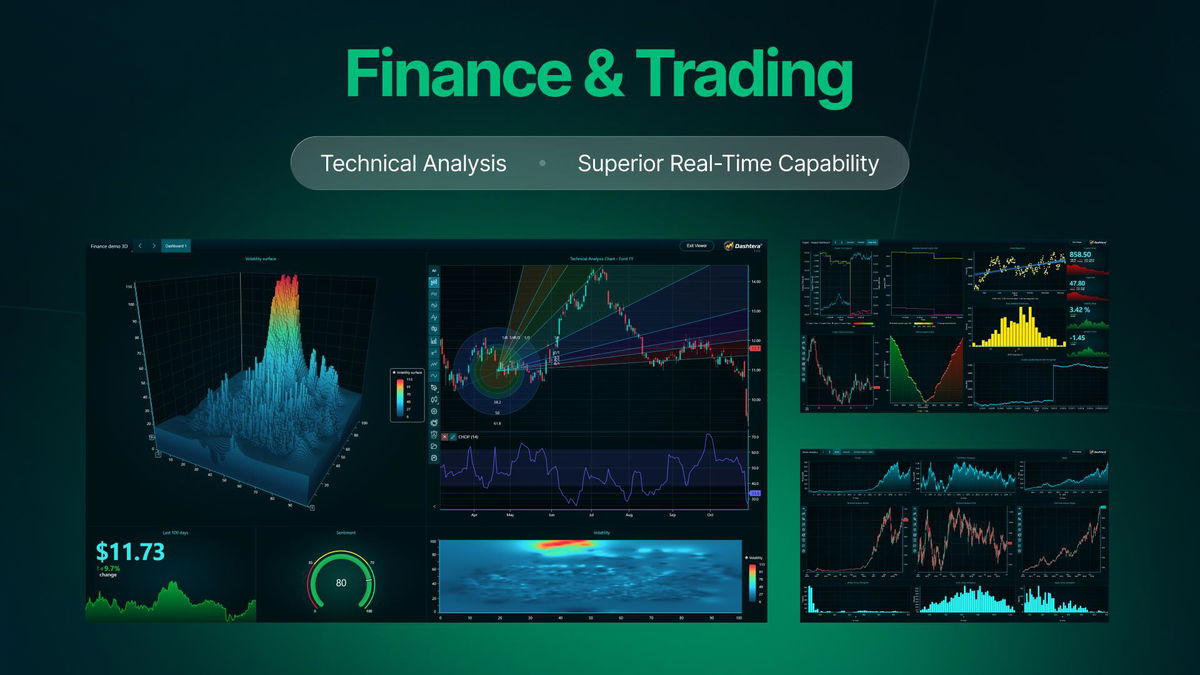
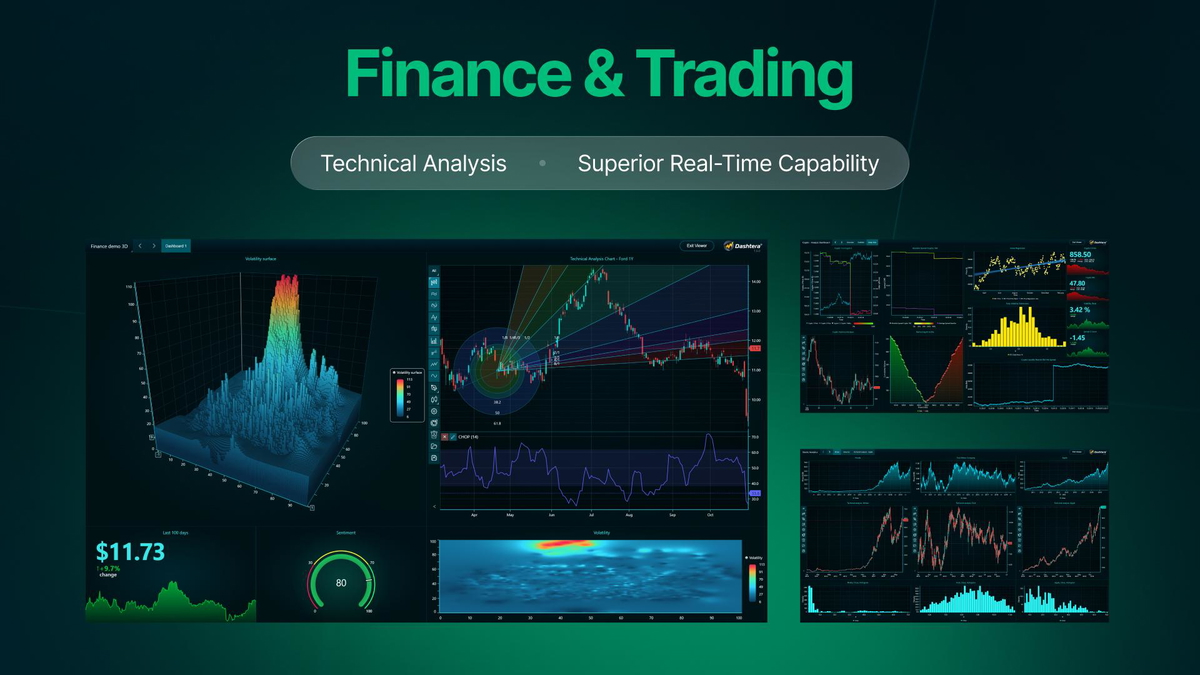
Finance and trading
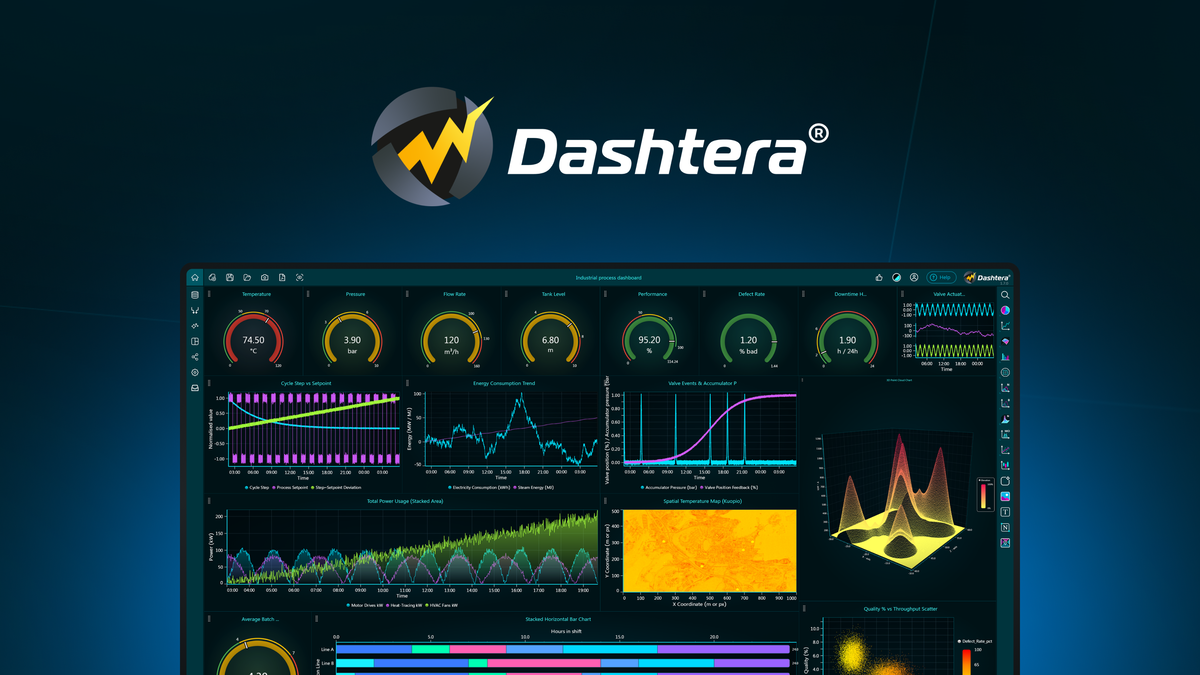
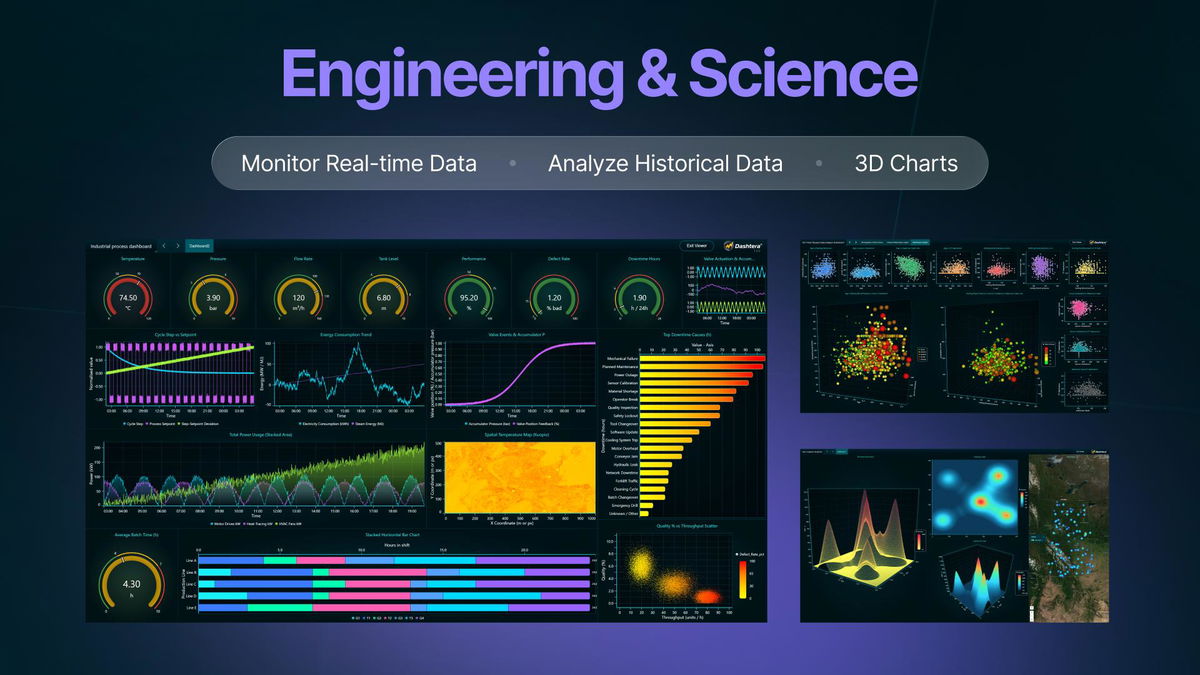
Engineering real-time and 3D monitoring

Dashtera

-70%$59
$199
  • Lifetime access
  • Refundable up to 60 days
  • Covered by our We Got Your Back guarantee

AppSumo Select

Carefully selected by AppSumo for quality, performance, and support

Slow dashboards mean you're making decisions on old numbers. Luckily, Dashtera connects your data sources to a no-code dashboard builder with GPU-accelerated charts that update in real time.

TL;DR

  • checkmarkConnect SQL, NoSQL, and streaming sources to build unlimited dashboards without writing a line of code
  • checkmarkShare dashboards via links or export them as PDF reports and PNG files for any audience

At-a-glance

dashtera.com

Alternative to

Grafana, PowerBI, Tableau

Integrations

Excel, Microsoft SQL Server, MySQL, PostgreSQL, MongoDB

Best for

Data analysts, Business intelligence, Researchers

Dashtera logo

Dashtera

Transform raw data into real-time dashboards with GPU-powered charts, interactive maps, and no-code setup

See your data from every angle

  • Build dashboards with basic, XY, 3D, bar, and polar charts to visualize any dataset your way
  • Spot trends and outliers instantly with KPI panels and statistics charts designed for fast scanning
  • Map your data geographically using interactive, high-performance WebGL maps
See your data from every angle

Work with your data, your way

  • Connect to PostgreSQL, MySQL, SQL Server, MongoDB, InfluxDB, and more without writing a query
  • Import data from CSV, JSON, and XML files to bring in exports, spreadsheets, or third-party data
  • Design and arrange your dashboard using the built-in drag-and-drop editor
Work with your data, your way

Track financial and trading data live

  • Plot markets with technical analysis charts—candlesticks, overlays, and multi-series indicators included
  • Drill down from portfolio-level views to individual trades using Dashtera's drill-through navigation
  • Stream real-time price feeds into responsive charts that reflect changes as they happen
Track financial and trading data live

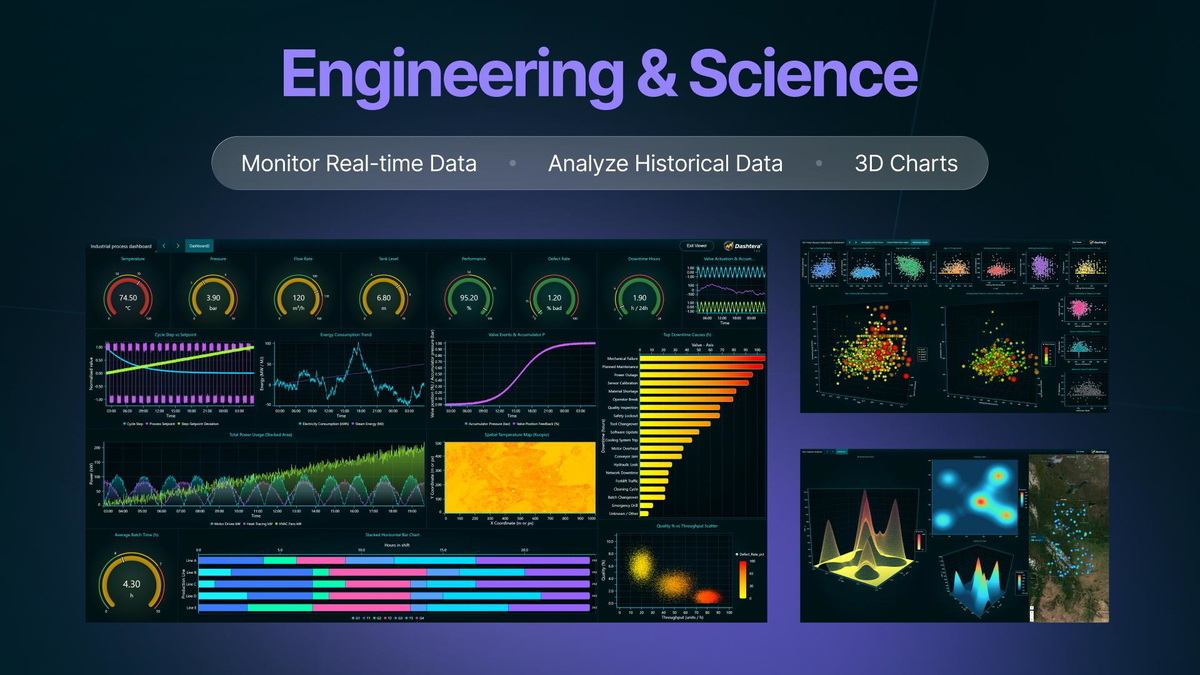
Monitor engineering and science data

  • Track sensor output with real-time charts across IoT (aka Internet of Things), industrial automation, and telemetric applications
  • Compare experiment runs using drill-down views and grouped data filtering
  • Render 3D charts for surface, scatter, and elevation data across complex scientific datasets
Monitor engineering and science data

Choose the plan that’s right for you

Feel secure in your purchase with AppSumo's 60 day money-back guarantee.

Recommended badgeRecommended
Refundable up to 60 days
Covered by our
We Got Your Back guarantee
Deal terms & conditions
Dashtera
See Dashtera
Founded March 19, 2026
🇫🇮Kuopio, Finland
11-50
Growth
Bootstrapped
Verified by PandaDoc

Democratizing data analytics

Hey Sumo-lings! 👋

Pasi here, Founder of Dashtera and LightningChart.

I’m very excited to introduce Dashtera to the AppSumo community.

Dashtera is our no-code data analytics and dashboarding platform, built to help people connect data sources, create interactive dashboards, and visualize large datasets without writing code.

Our team is known for LightningChart — high-performance data visualization technology used in demanding, data-intensive applications. With Dashtera, we wanted to bring that same performance to teams who need powerful dashboards but often get stuck between spreadsheets, heavy BI tools, disconnected data sources, and complex technical setups.

That is why we built Dashtera.

With Dashtera, you can connect your data, drag and drop visualizations, configure dashboards, and start exploring insights in minutes.

What makes Dashtera different is the technology behind it. Dashtera is powered by WebGL-based GPU acceleration, helping users visualize large and complex datasets smoothly in the browser. It is designed not only for simple dashboards, but also for real-time streaming data, high-frequency data, large data volumes displayed on screen, engineering data, financial data, IoT data, scientific analytics, and business intelligence.

Dashtera already includes 90+ chart types and is built for workflows such as:👉 Business intelligence and operational dashboards👉 Real-time monitoring and streaming dashboards👉 IoT and industrial data visualization👉 Engineering, scientific, and financial analytics👉 Reporting and collaborative data exploration

Our mission is simple: make high-performance data visualization accessible to everyone.

Not every team has developers available to build custom dashboards. Not every company wants to spend months setting up complex BI infrastructure. And not every dataset should be forced into slow, limited, or overly simplified visualizations.

Dashtera gives users a faster way to turn raw data into clear, interactive dashboards — while still being powered by serious visualization technology underneath.

If you work with spreadsheets, databases, dashboards, reports, or real-time data, we’d love for you to try Dashtera, share your feedback, and help us build the future of high-performance data visualization.

Grab the lifetime deal, build your first dashboard, and let us know what you want us to improve next.

Happy dashboarding 🚀

— Pasi TuomainenFounder, Dashtera & LightningChart

Pasi Tuomainen
Founder & CEO

Questions & reviews