INSIA
Search-based business intelligence and analytics platform designed for non-technical users
Are you fed up with slow analysis on Excel, CSV, or Google Sheets?
Do you lack the resources to perform critical data analysis such as day of the week, aging, and time series on important KPIs?
Do you have trouble identifying the root cause of business performance deviations?
Introducing INSIA, a cutting-edge analytics platform that is changing how businesses analyze data.
INSIA is a no-code, self-serve platform that makes analytics more accessible than ever.
TL;DR
At-a-glance
Alternative to
Integrations
Features
Overview
With INSIA, you can:
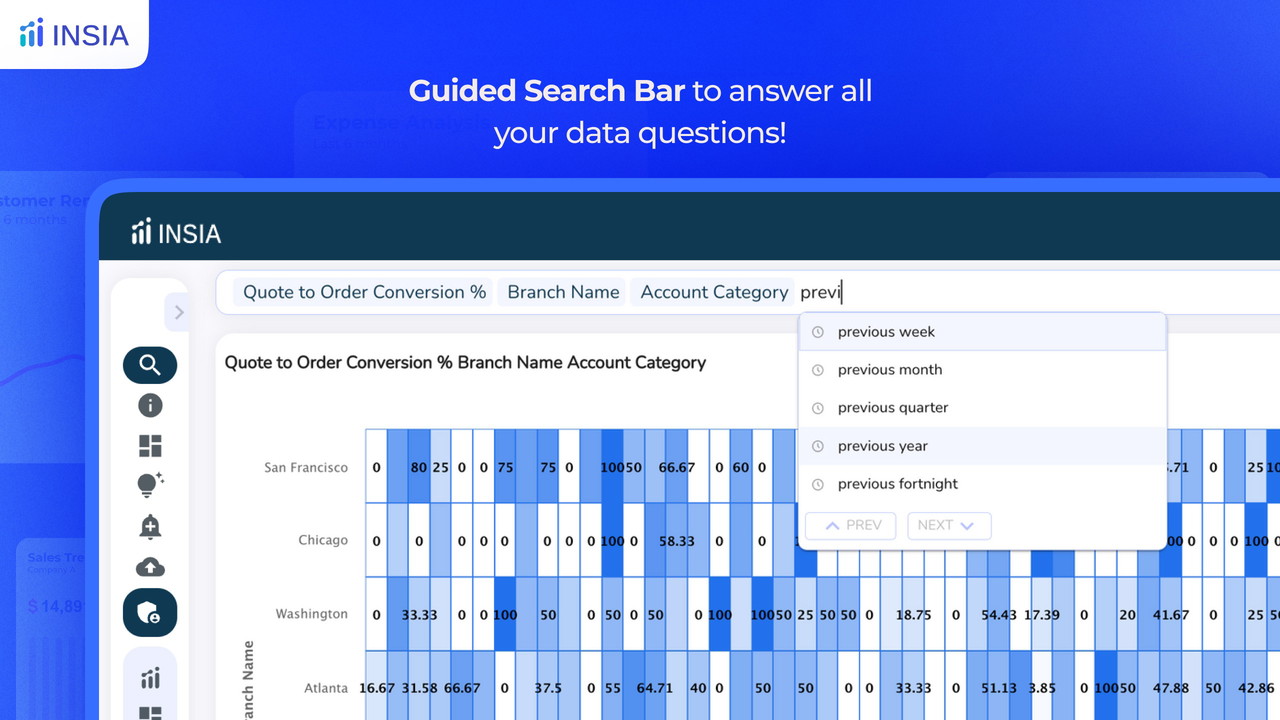
- Get answers to all your data questions by simply typing in a guided search bar.
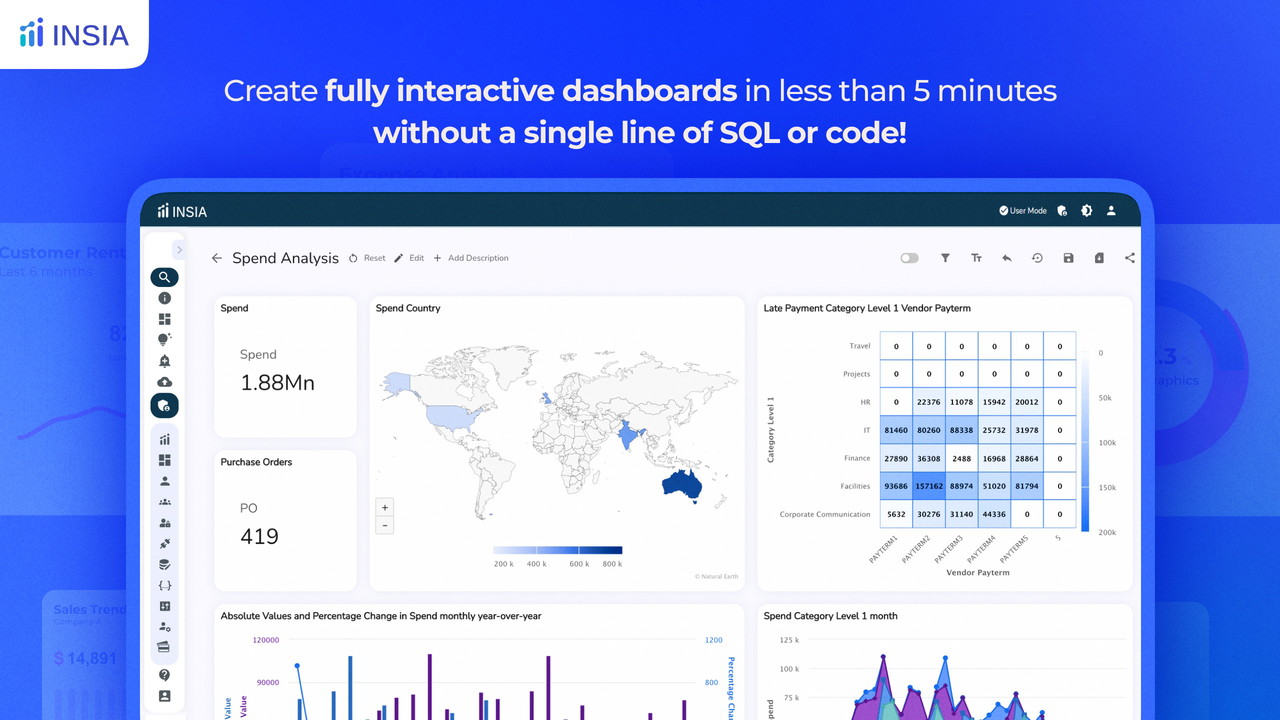
- Create stunning interactive dashboards in under 5 minutes without any technical support.
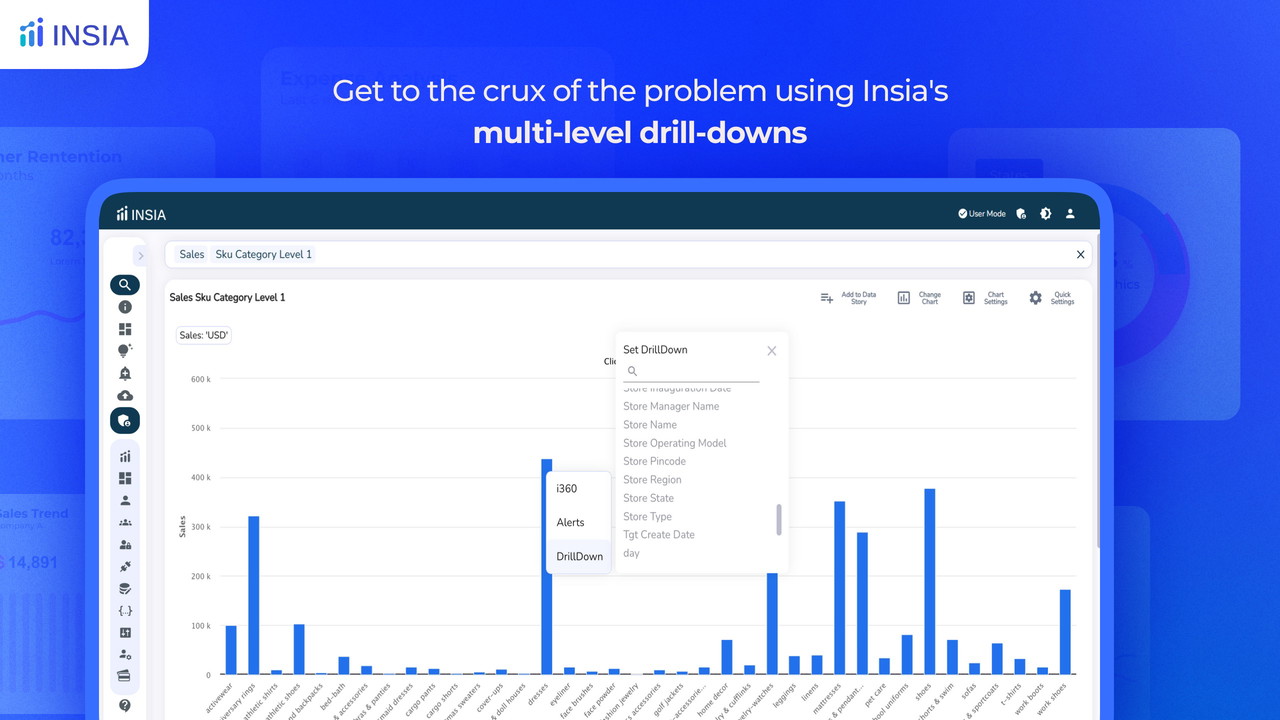
- Get to the crux of the problem using INSIA’s multi-path drill-downs.
- Seamlessly integrate with Excel files, databases, and platform APIs to get a holistic view of your entire business data.
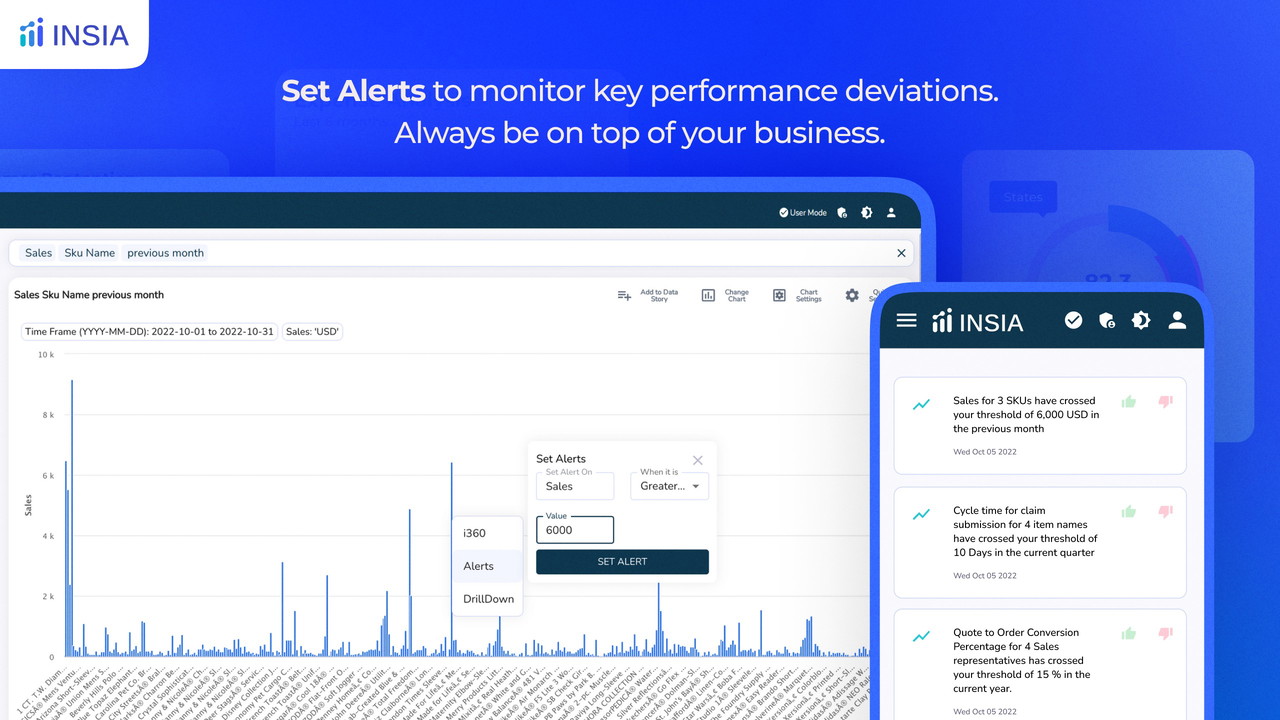
- Set alerts for any performance deviations and always be on top of your business.
- Create custom KPIs using INSIA's robust no-code formula builder.
INSIA's guided search bar provides you the agility to perform any ad-hoc analysis without requiring any technical support.
Place the cursor on the search bar, and the platform automatically guides you through your journey to find business insights.
INSIA uses machine learning to understand data search patterns and recommends the next best cut and analysis for your data as you search.
Using the INSIA drop-down, all data points on your database are covered, and you get the most out of your data!
Do you have to wait days for a dashboard to be created?
And even so, sometimes it's a far cry from what you expected...
Well, those days are gone!
Now with INSIA, you can create unlimited dashboards and reports using the power of search.
INSIA provides a canvas for you to create your own data stories, reports, or dashboards and share them with a click of a button.
No more relying on others to build the report you want! Instead, your dashboards can be created, visualized, and automated in as little as 5 minutes.
We know the struggle of missing out on significant business performance deviations and then playing catch-up.
With INSIA, you are always on top of your business!
You can monitor your critical KPIs by setting manual thresholds in just a few clicks.
INSIA understands the context & timeframe, pushing alerts in natural language automatically every time there is a performance deviation.
And guess what else? You can view specific KPIs and how much they have crossed the set manual threshold with just one click!
We all know the importance of getting to the crux of any business problem.
But at the same time, it's not that easy when you are working with data spread across multiple columns and tables.
What if we told you that all you have to do is right-click?
INSIA's smart drill-down gives you the capability to analyze data from different vantage points.
Now, you are not limited to a defined drill-path and can move from a one-dimensional cut to another while getting deep into the problem.
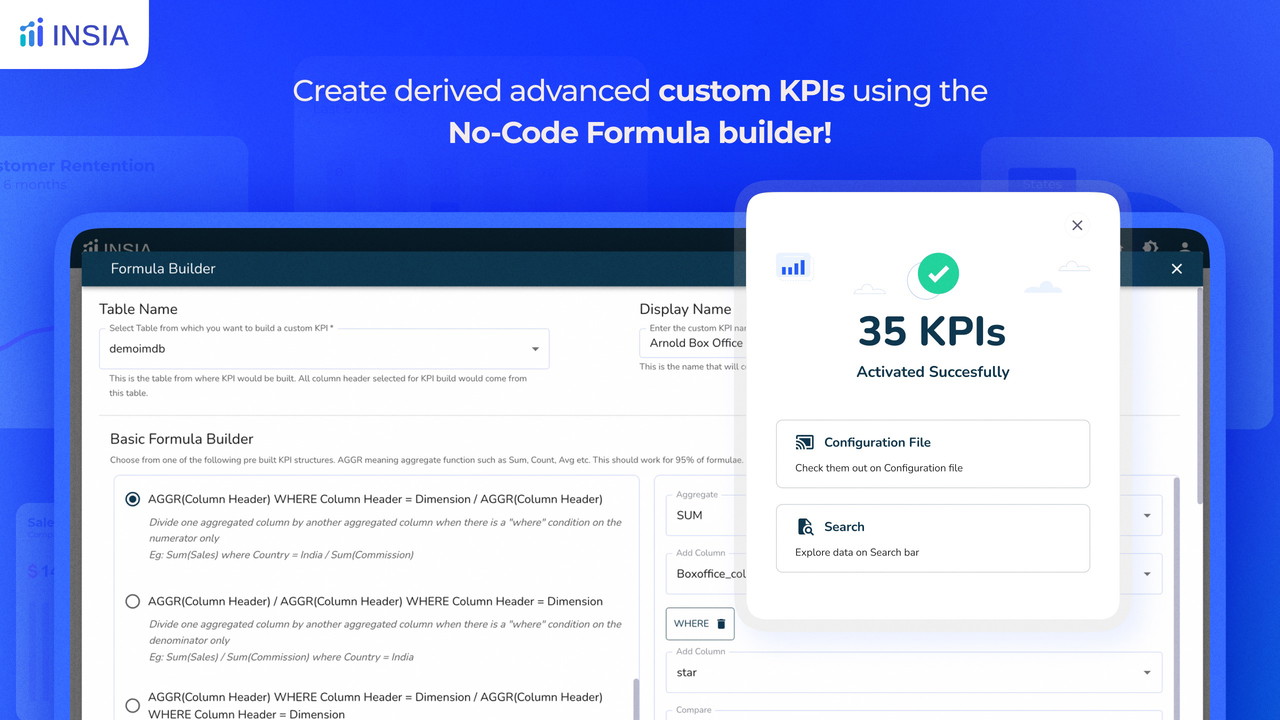
As much as you may want to, you cannot create all KPIs directly from your data columns.
You need derived KPIs, which could be:
- The ratio of a few data columns (E.g., Efficiency % = Cost/Revenue)
- A mathematical operation on a couple of data columns (E.g., the Cycle time of Order Delivery = Delivery date - Order date)
- Conditional formulas (E.g., NYC sales % = Sales where City is New York/ Total Sales)
What if you could create all these custom KPIs without writing a single line of code? (You don't even need to remember Excel syntax!)
With INSIA, you can create custom KPIs using an intuitive drop-down-based, no-code formula builder.
Leverage data and grow your business manifold through simplified analytics powered by INSIA.
Experience the simplicity, speed, and scale of analytics with INSIA.
Get access to INSIA today!
Plans & features
Deal terms & conditions
- 1 Year of access to INSIA
- You must redeem your code(s) within 60 days of purchase
- 1 Year of plan updates
- Please note: This deal is not stackable
60 day money-back guarantee. Try it out for 2 months to make sure it's right for you!